SitePulse is a self-hosted, privacy-friendly monitoring dashboard for small websites and the servers behind them. One workspace at sp.micstec.com brings together cookie-free pageview analytics, uptime checks, SEO and AI-visibility audits, downloadable PDF reports, Linux host monitoring, a contact-form inbox and a command-line client. This guide covers every part of the dashboard, with screenshots from a test copy of SitePulse filled with made-up example data.
| Best for | Owners and maintainers of small-business, personal and project websites, landing pages, APIs and the Linux servers that host them |
| You need | A Google account and approval from a SitePulse administrator. To count pageviews or collect form messages you must be able to add a <script> tag to your site. Host monitoring needs sudo on a Linux server |
| Works on | Any current desktop or mobile browser. It can be installed as an app (PWA). The optional sitepulse-cli runs on Linux and macOS with Node.js 22 or later |
| Cost | No prices or plans appear anywhere in the app. Access is by administrator approval |
| What it stores | Normalized page paths and anonymous pageview counts, uptime and audit results, host CPU/memory/disk figures, and the contact messages visitors send you. It sets no cookies on your visitors and stores no query strings, page titles, IP addresses, full user-agent strings or visitor IDs |
What SitePulse can do
| Area | What you get | Where in the app |
|---|---|---|
| Website analytics | Total and per-site pageviews, a daily traffic chart and the most-viewed pages | Dashboard, a site's Overview |
| Tracking snippet | A 3 KB script that counts pageviews without cookies, including single-page-app route changes | Tracking setup card |
| Uptime checks | Scheduled checks of any public URL, reported as Up, Slow, Down or Error | Health checks on a site, or a health-only site |
| SEO and AI-visibility audits | Scored checklists for search engines and AI answer engines, on demand or on a schedule | SEO/GEO on each health check |
| PDF reports | A shareable report with charts, top pages, audit findings and uptime | Preview report / Download PDF |
| Host monitoring | CPU, memory, disk, load and uptime pushed from your Linux servers | Hosts |
| Contact messages | Contact-form submissions from your sites, filed into one inbox | Contact form plugin card, Messages |
| Automation | Personal API tokens and sitepulse-cli for scripts |
CLI access card, terminal |
| Administration | Approve, reject, suspend and promote accounts | Manage users (administrators only) |
SitePulse does not show referrers or traffic sources, devices, browsers, countries, unique visitors, bounce rate, time on page or a live "visitors right now" counter, and it does not send downtime alerts. See What SitePulse does not do.
Sign in and get access
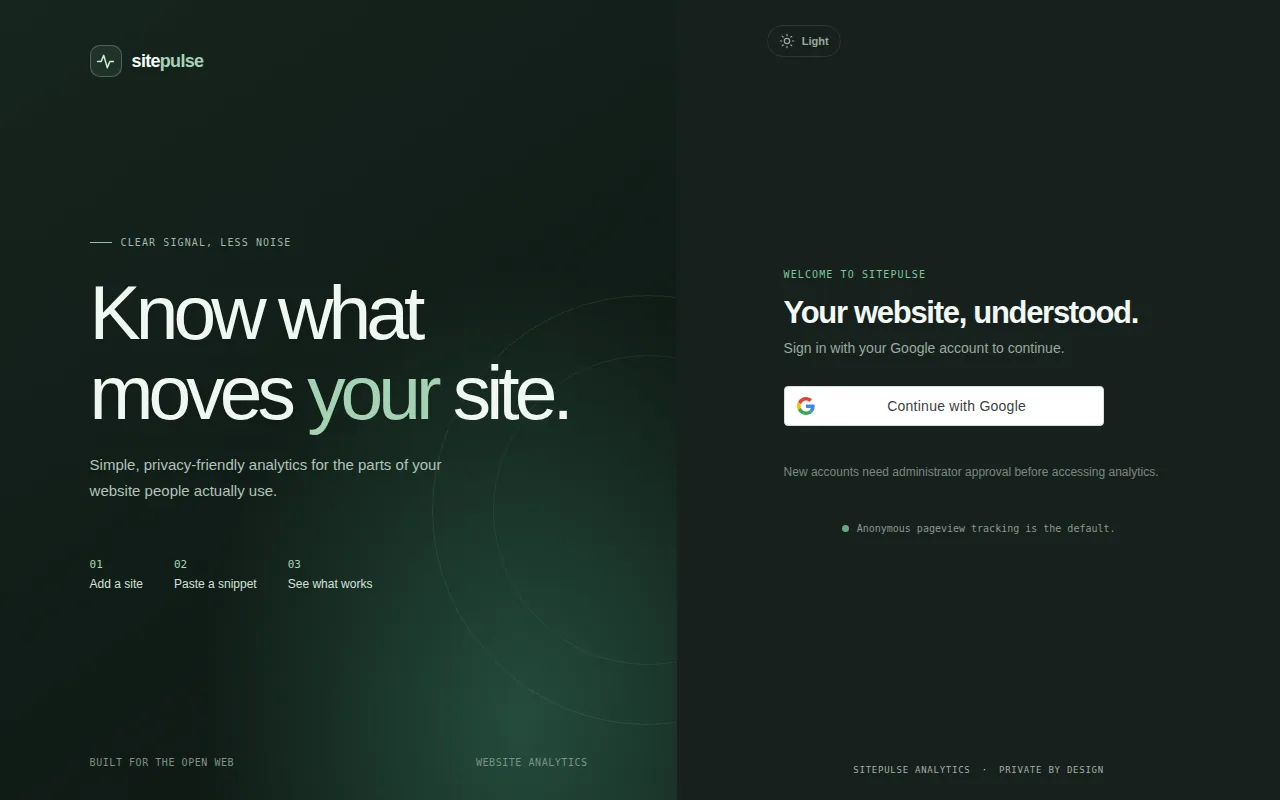
- Open sp.micstec.com. The sign-in page reads Your website, understood.
- Choose Continue with Google and pick your Google account. Google is the only way to sign in. There is no password sign-up or password reset.
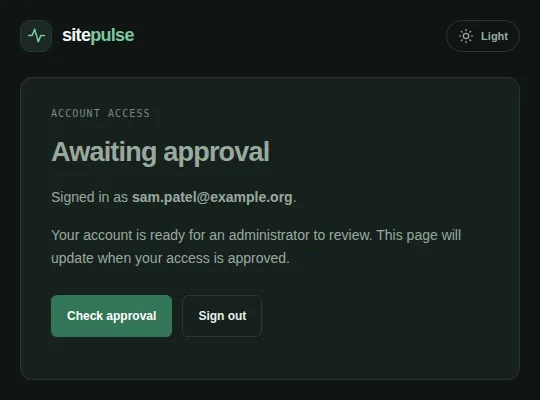
- A brand-new account starts as pending. You see an Awaiting approval card that shows the email you signed in with.
- Ask your SitePulse administrator to approve you. The card checks for approval automatically every 15 seconds while it is open. You can also choose Check approval to check straight away. Sign out returns you to the sign-in page.
- Once you are approved, the dashboard opens. Each approved person gets a separate, private workspace, named "Your name's workspace". Your websites, checks, hosts and messages are visible only in your workspace. Administrators cannot see them either.
| Account state | What you see |
|---|---|
| Awaiting approval (pending) | The approval card. It updates on its own once you are approved |
| Access suspended | "Contact your administrator if you need access to SitePulse." Suspension also signs you out everywhere |
| Access not approved (rejected) | The same message. An administrator can still approve you later |
Sign-in sessions last 30 days by default. To sign out, use the arrow icon beside your email at the bottom of the sidebar.
Find your way around
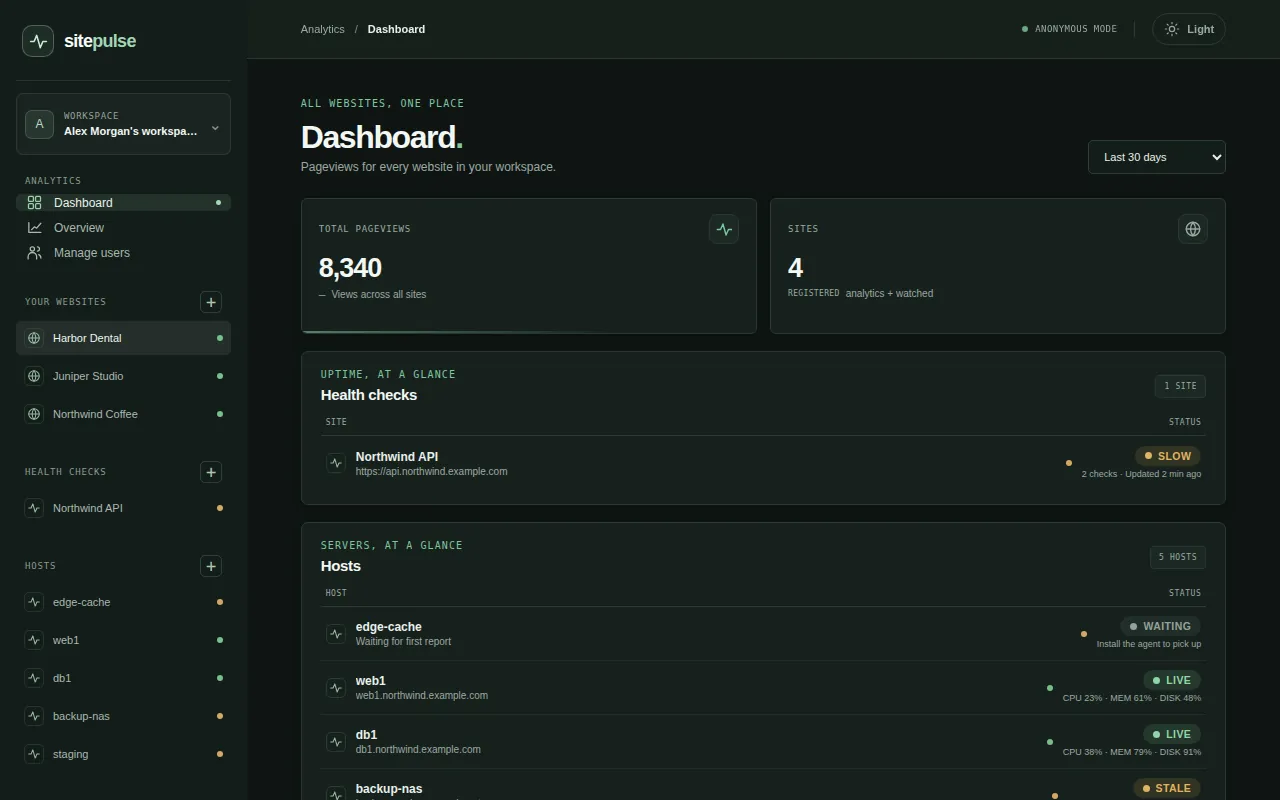
The sidebar on the left has these groups:
| Sidebar item | What it opens |
|---|---|
| Dashboard | Totals and status tables for the whole workspace |
| Overview | The analytics page for the selected website |
| Manage users | User administration. Only administrators see this item |
| YOUR WEBSITES and + | Your analytics sites. + opens the Add your website form |
| HEALTH CHECKS and + | Sites that are watched without a tracking script. + opens the add form with Health checks only selected |
| HOSTS and + | Monitored Linux servers. + opens the Hosts page |
| MESSAGES and + | The contact Inbox plus a per-site inbox for each analytics site. A badge such as 3 NEW counts unread messages |
A coloured dot beside each item shows its state: green when a site is receiving pageviews, all checks are up or a host is live; amber while it waits or something is slow or stale; red when a check is down or failing. Hover over the dot to see its meaning.
The top bar shows where you are (for example Analytics / Dashboard), a privacy label (ANONYMOUS MODE, or HEALTH ONLY on a health-only site) and the Light / Dark theme button. Dark is the default. Your choice is remembered in this browser and also applies to the sign-in and approval screens.
Pages refresh themselves while the browser tab is visible: dashboard and site figures every 15 seconds, and health checks, hosts and messages every 30 seconds. You never need to reload.
Add a website
- Choose + beside YOUR WEBSITES. On an empty workspace you can also choose Add your website on the Start with one small signal. card.
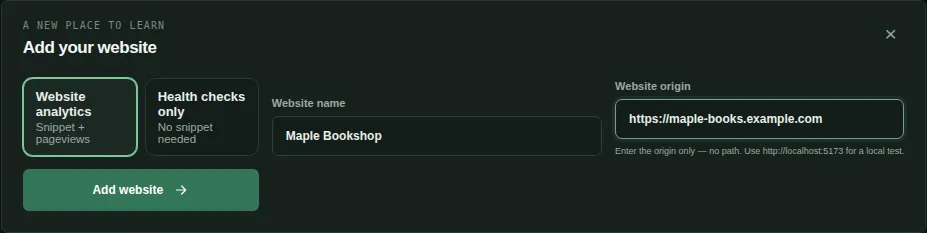
- In the Add your website form, pick the site type:
- Website analytics (Snippet + pageviews): counts pageviews with the tracking snippet. You can also add health checks and the contact form plugin to it.
- Health checks only (No snippet needed): watches the site with uptime checks and audits only. No script is installed and pageviews are not collected.
- Enter a Website name (up to 80 characters).
- Enter the Website origin: the scheme and domain only, such as
https://example.com. Public sites must usehttps://. Do not add a path, query or trailing page name. - Choose Add website. The site's Overview opens.
| Message | Meaning |
|---|---|
| "Use an origin only (scheme and domain). Public sites must use HTTPS." | The origin has a path, query or http:// |
| "That origin is already a website here. Open it and add a health check on the same page." | You already track this domain. Choose Add a check on Site name in the banner to jump to that site's Add check form |
| "That origin is already a website in this workspace. Add a check on it instead." | The domain already exists as a health-only site |
www.example.com and example.com are different origins. Register the one your visitors actually load, and add the other as a secondary origin if both serve pages.
Install the tracking snippet
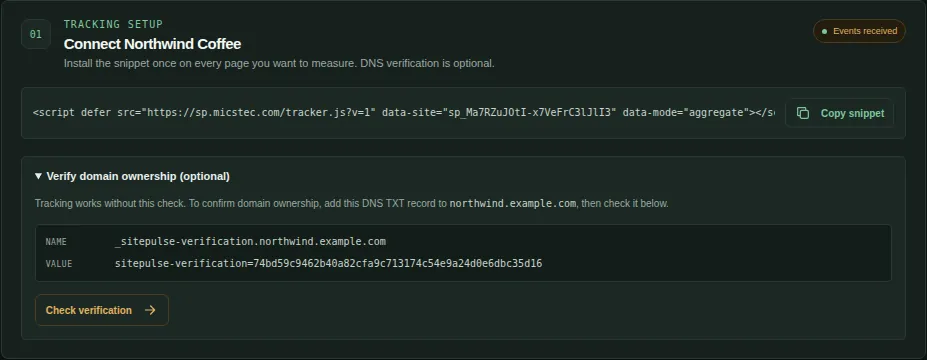
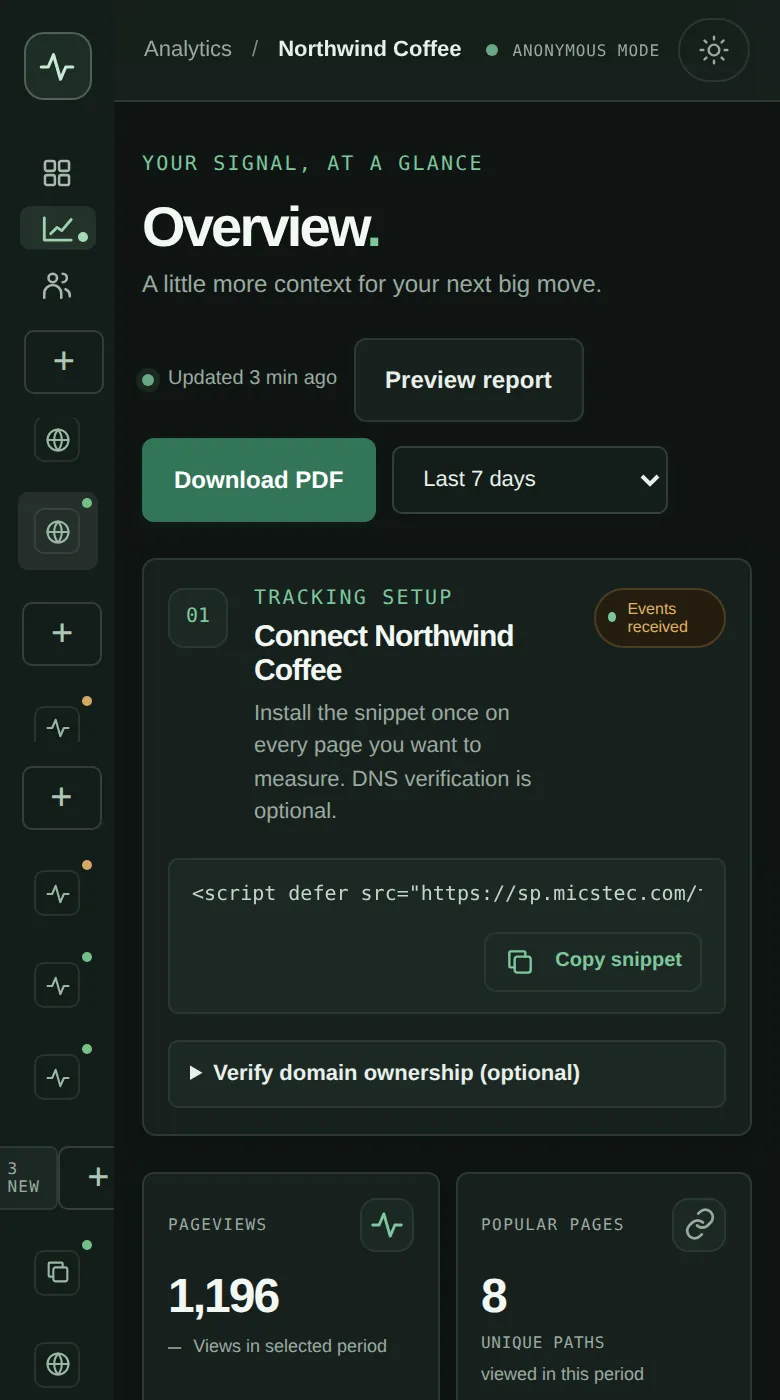
Every analytics site's Overview starts with the Tracking setup card (Connect Site name).
Choose Copy snippet. The snippet looks like this, with your own public site ID:
<script defer src="https://sp.micstec.com/tracker.js?v=1" data-site="sp_…" data-mode="aggregate"></script>Paste it inside the
<head>of every page you want to count. In a site builder or CMS, use its "header code" or "custom HTML in head" setting.Publish your site and open one of its pages in a browser.
Back in SitePulse, the status pill changes from Awaiting first visit to Events received within about 15 seconds. The sidebar dot turns green.
What the script counts
| Behaviour | Detail |
|---|---|
| Size and loading | About 3 KB, loaded with defer. It never blocks your page. Failed sends are retried twice and then dropped |
| Pageviews | One pageview for each page load, plus one for each path change in single-page apps (pushState, replaceState, back/forward, and pages restored from the back-forward cache) |
| Paths | Only the path is kept. /pricing?ref=ad and /pricing#plans both count as /pricing. Paths up to 512 characters |
| Not counted | Pages shown inside an iframe, copies of your snippet on domains you have not registered, and visitors whose ad blocker stops the script |
| Collected but not shown | The referring site's host name (first pageview only, and never your own domain) and the browser language. They are stored but no dashboard, report or CLI command shows them |
| Never collected | Cookies, local storage IDs, IP addresses, full user agents, page titles, query strings and fragments |
The Overview's Collection mode card reads Aggregate · No persistent visitor IDs: every pageview is anonymous and separate, so SitePulse counts pageviews, not people.
Snippet options
| Attribute or call | Use |
|---|---|
data-site="sp_…" |
Required. Your site's public ID (it is safe to publish) |
data-mode="aggregate" |
The default anonymous counting mode |
data-mode="off" |
Loads the script without sending anything until you call window.sitepulse.setCollectionMode("aggregate"). This is useful if you wait for a consent banner |
window.sitepulse.setCollectionMode("off") |
Stops sending and discards queued pageviews |
data-manual="true" |
Turns off automatic counting. Call window.sitepulse.page({ path: "/products/:id" }) yourself on each route change. Do not mix manual calls with automatic tracking |
If your site has a Content Security Policy, allow https://sp.micstec.com in both script-src and connect-src.
Verify domain ownership (optional)
Verification is optional and does not affect data collection.
- Expand Verify domain ownership (optional) and choose Show DNS record.
- Add the TXT record shown, NAME
_sitepulse-verification.<your domain>with the VALUEsitepulse-verification=…, at your DNS provider. - When DNS has updated, choose Check verification. The card then shows Domain verified. If the record is not visible yet you see "DNS verification record was not found yet". Try again later.
Read your traffic
Dashboard: all sites at once
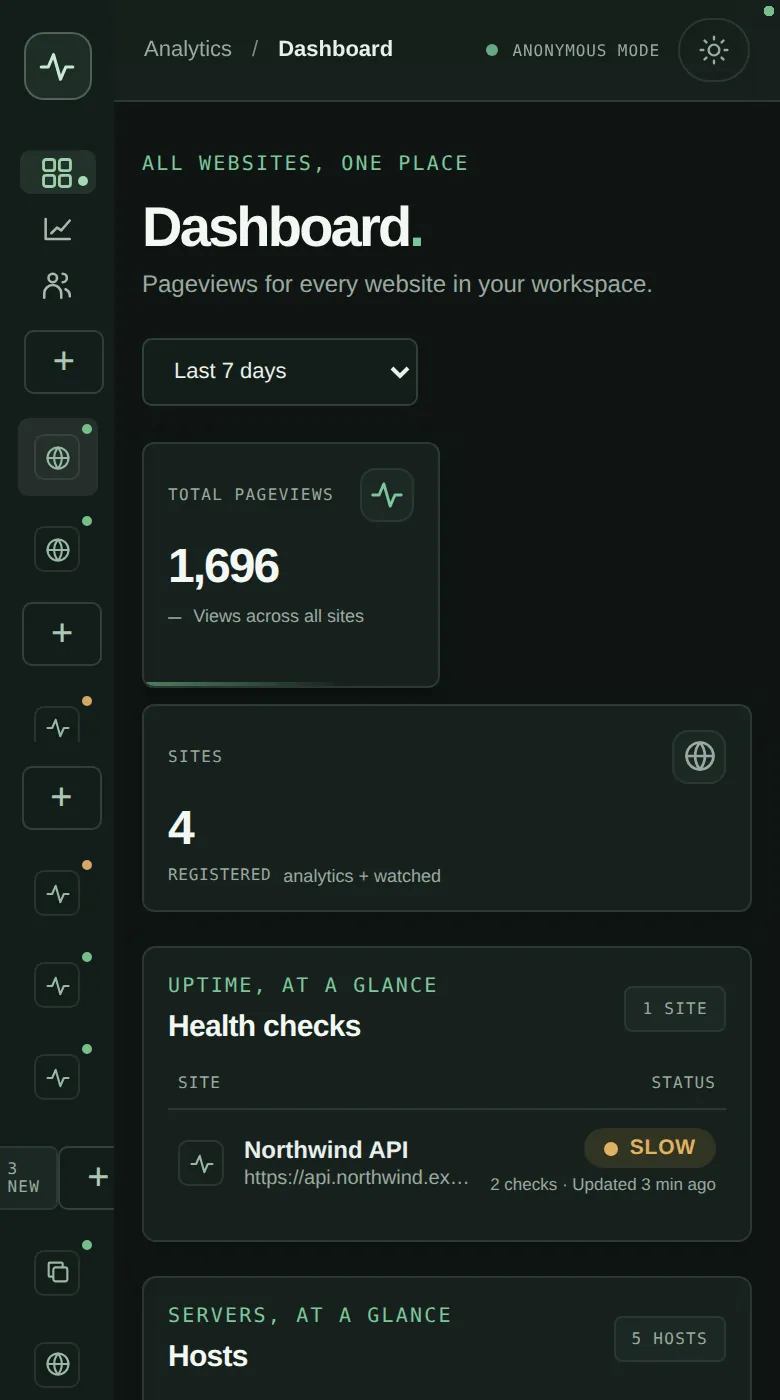
The Dashboard (ALL WEBSITES, ONE PLACE) shows:
- TOTAL PAGEVIEWS across all analytics sites and SITES (analytics plus health-only) for the selected range.
- Health checks (UPTIME, AT A GLANCE): each health-only site with its worst current status and when it was last checked.
- Hosts (SERVERS, AT A GLANCE): each server's status and its latest CPU, memory and disk use.
- Contact inbox (VISITOR MESSAGES): new and total messages per site. This appears once you have at least one message.
- All websites (PAGEVIEWS BY SITE): pageviews per site, busiest first, with when each was last updated. Ten sites are shown per page, with Previous / Next.
- CLI access: see Use the command line.
Select a row to open that site, host list or inbox.
Overview: one site in detail
Choose a site in the sidebar, or Overview, to open its page (YOUR SIGNAL, AT A GLANCE).
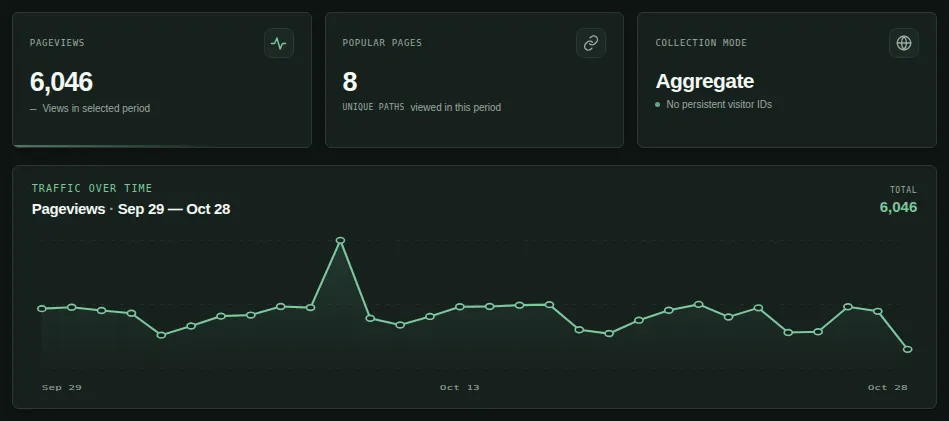
| Card | What it shows |
|---|---|
| PAGEVIEWS | Pageviews in the selected range |
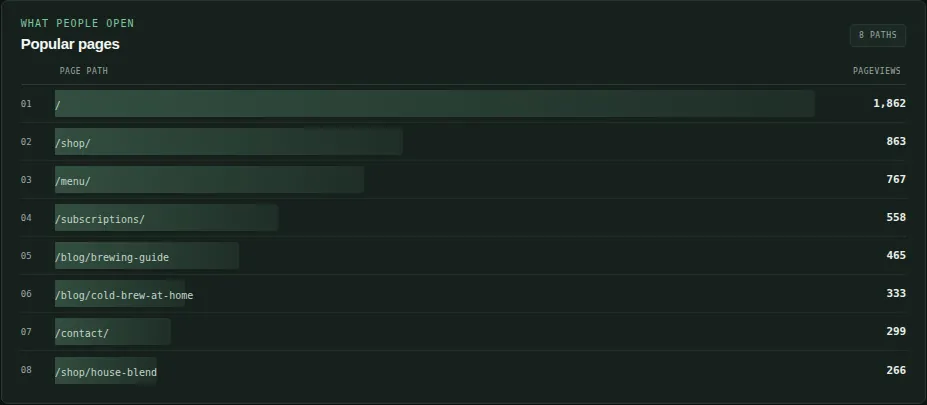
| POPULAR PAGES | How many paths appear in the Popular pages list. This list holds at most 8, so the card never shows more than 8 even if more paths had visits |
| COLLECTION MODE | Aggregate: no persistent visitor IDs |
| TRAFFIC OVER TIME | A line chart of pageviews per day, with the range dates and the TOTAL |
| Popular pages | The 8 most-viewed paths, ranked, with their pageview counts and a bar for each |
| Freshness note | Updated n min ago (time of the latest pageview), or Waiting for your first pageview |
Choose the date range
The range selector appears on the Dashboard and on each Overview. One choice applies to both:
| Option | Covers |
|---|---|
| Last 7 days (default) | Today and the 6 days before it |
| Last 30 days / Last 90 days | The last 30 or 90 days including today |
| Last 12 months | The last 365 days |
| All time | From the day your oldest analytics site was added, up to 730 days back |
The range ends on today's date in your time zone, but pageviews are grouped into days by UTC time. Late-evening visits in the Americas may therefore appear under the next day.
One website on several domains
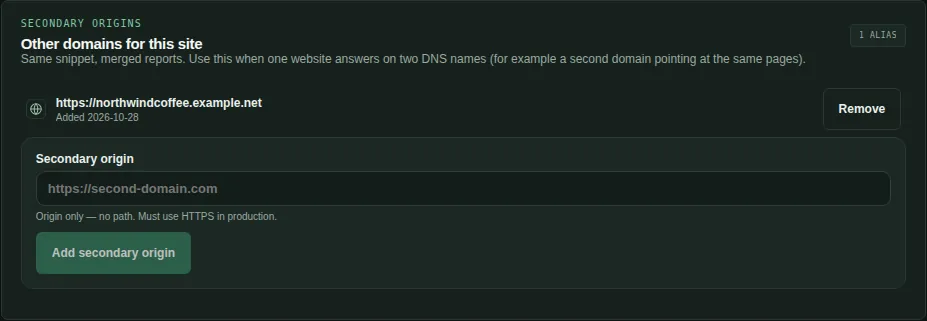
If the same site answers on two names, for example https://example.com and a second domain pointing at the same pages, merge them into one report:
- Open the site's Overview and scroll to Other domains for this site (SECONDARY ORIGINS).
- Enter the Secondary origin, such as
https://example.net, and choose Add secondary origin. - Install the same snippet on the second domain. Visits from both origins are added to this site's figures.
To stop collecting from an alias, choose Remove. Past pageviews are kept. Health-only sites cannot have secondary origins.
Change a site's name, domain or type
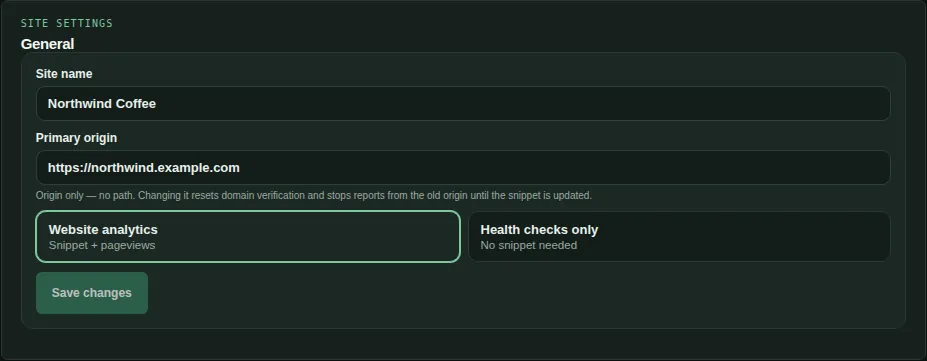
The General card (SITE SETTINGS) near the bottom of every Overview lets you:
- change the Site name;
- change the Primary origin (the site moves to a new domain);
- switch between Website analytics and Health checks only.
Choose Save changes. It is enabled only after you change something. A note confirms what happened:
| Change | Result |
|---|---|
| New origin, analytics site | Collection from the old origin stops at once. Update the snippet on the new domain. Domain verification is reset and a new DNS record is shown |
| New origin, health-only site | Existing checks keep their own URLs. Edit them if they point at the old domain |
| Switch to Health checks only | "Pageview collection is now off for this site. Past analytics are kept." |
| Switch back to Website analytics | Install the snippet again to resume counting |
Websites cannot be deleted from the dashboard or the CLI. To stop monitoring a site, remove its snippet, switch it to Health checks only, or pause or delete its checks.
Monitor uptime with health checks
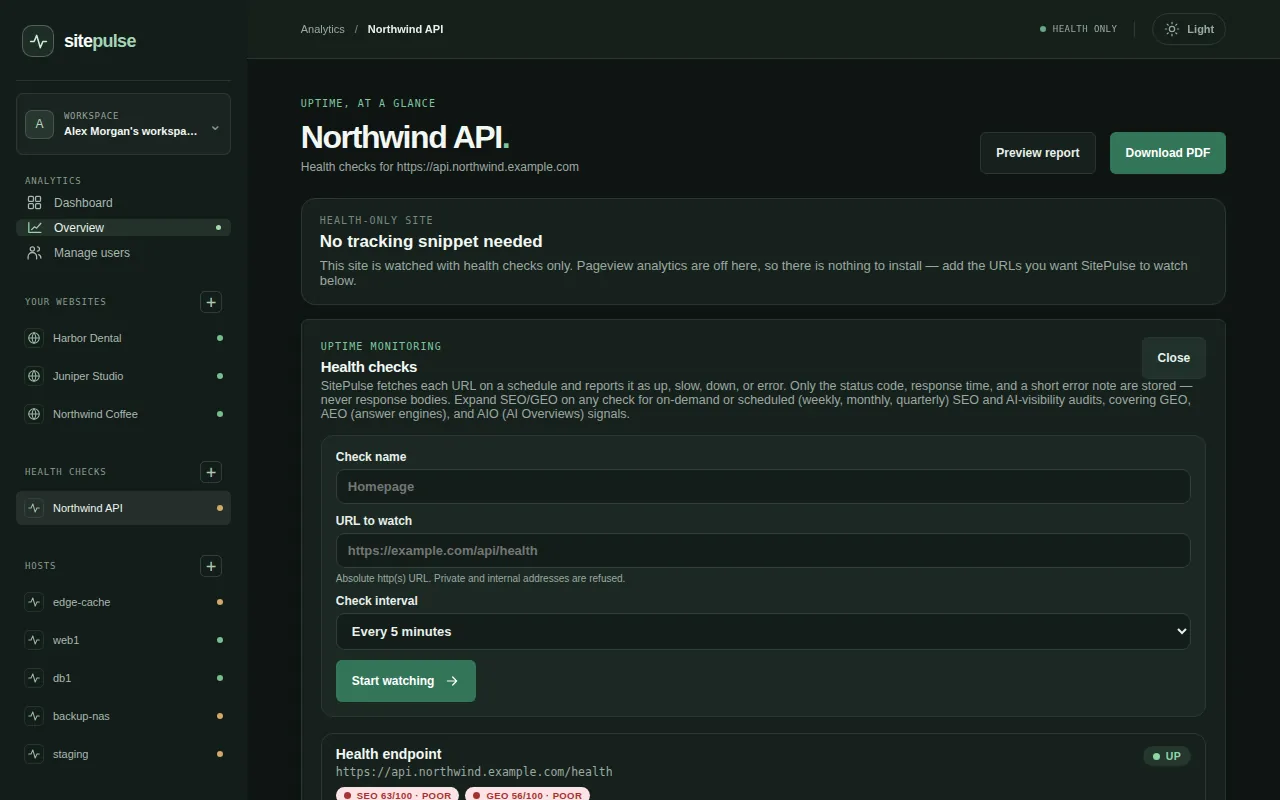
Every site, analytics or health-only, has a Health checks card (UPTIME MONITORING). SitePulse fetches each URL on a schedule from its server and records the result.
Add a check
- On the site's Overview, choose Add check. For a site watched without a tracker, first add a site with + beside HEALTH CHECKS.
- Enter a Check name (up to 80 characters), such as Homepage.
- Enter the URL to watch: any public
http://orhttps://address, such as a homepage orhttps://example.com/api/health. - Choose a Check interval: Every minute, Every 5 minutes (default), Every 15 minutes, Every 30 minutes or Every hour.
- Choose Start watching. The check appears as Pending until its first run, and its first SEO and AI-visibility audits start automatically.
URLs on private networks, localhost, link-local or cloud metadata addresses are refused ("That address is not allowed for health checks"). So are host names that do not resolve ("That hostname could not be resolved") and URLs that are already watched on that site.
Read the results
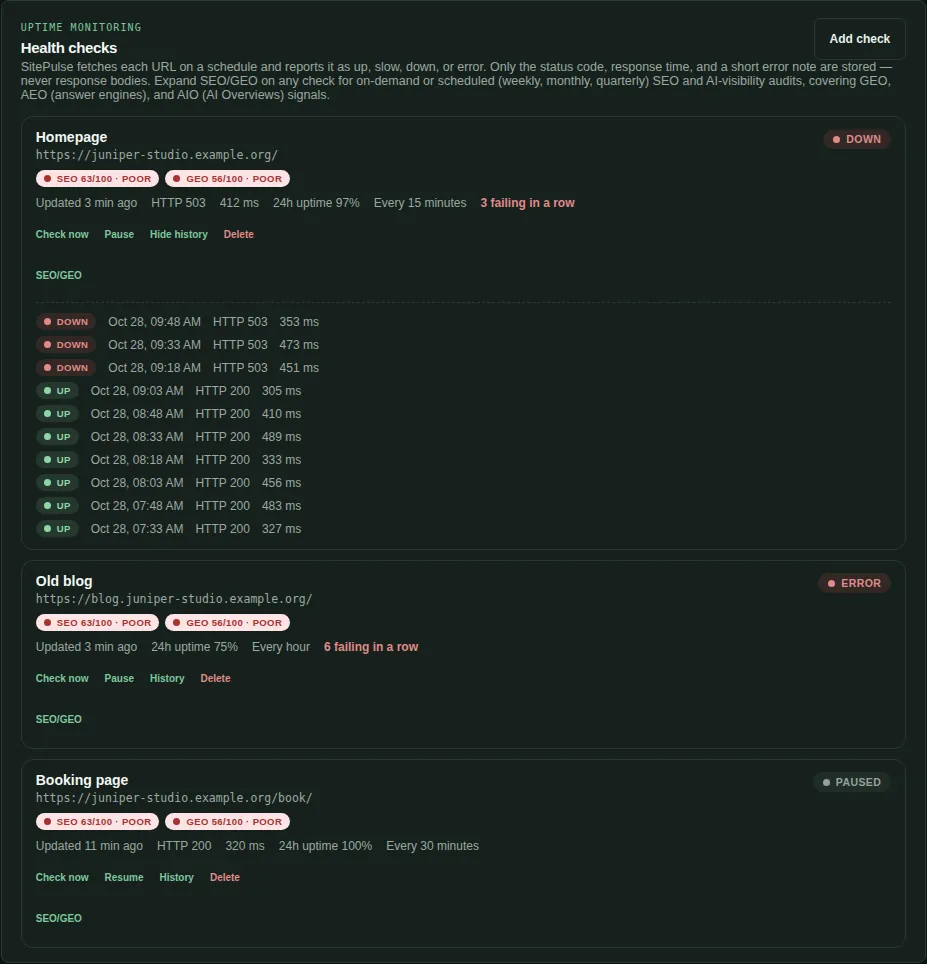
| Status | Meaning |
|---|---|
| Pending | Not checked yet |
| Up | A 2xx or 3xx response within the slow threshold (2,000 ms by default) |
| Slow | A 2xx or 3xx response that took longer than the threshold |
| Down | A 4xx or 5xx response |
| Error | No HTTP response: DNS failure, refused or interrupted connection, a timeout (10 seconds by default), a TLS problem or too many redirects (more than 5) |
| Paused | You paused the check |
Each check row shows its last result (Updated n min ago, HTTP 200, response time in ms), 24h uptime (the share of the last 24 hours' checks that were Up or Slow), its interval, and a red n failing in a row note when it keeps failing. The row's SEO and GEO pills show the latest audit scores.
| Button | What it does |
|---|---|
| Check now | Runs the check immediately (up to 12 manual checks per minute) |
| Pause / Resume | Stops or restarts scheduled checks |
| History / Hide history | Shows the last 10 results with time, status, HTTP code, time taken and any error |
| Delete | Asks "Delete this health check and its history?" and then removes it |
| SEO/GEO | Opens the audit panel (next section) |
SitePulse keeps up to 1,000 results per check, for 90 days. Only the status code, response time and a short error note are stored. Page content is discarded. The method (GET or HEAD), timeout (2–30 seconds) and slow threshold (0.5–30 seconds) can be changed with the CLI's monitors update. The dashboard always uses the defaults.
SitePulse shows status in the dashboard only. It does not email, text or otherwise notify you when a check goes down.
Run SEO and AI-visibility audits
Each health check can audit its page for search engines (SEO) and for AI search and answer engines (AI-visibility (GEO/AEO/AIO): Generative Engine Optimization, Answer Engine Optimization and AI Overviews).
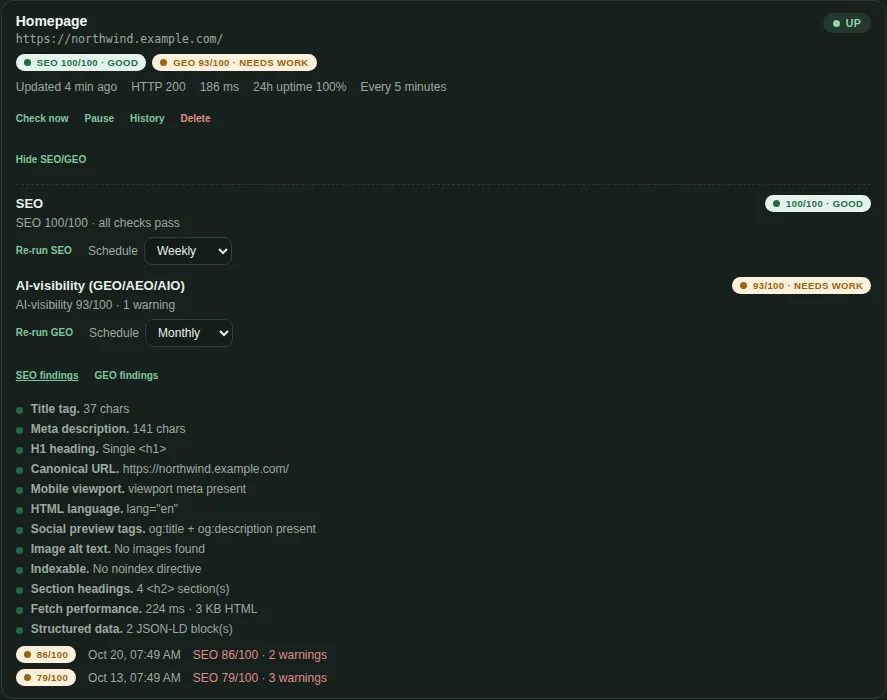
- Choose SEO/GEO on a check.
- For each kind, choose Run SEO audit / Run GEO audit (Re-run once it has a result) to audit now. You can run up to 12 audits per minute.
- Set a Schedule for each kind: Off, Weekly, Monthly or Quarterly. Scheduled audits are picked up by a background job that runs about every 15 minutes.
- Switch between SEO findings and GEO findings to see each item marked pass (green), warning (amber) or fail (red), with a short detail. Earlier results are listed under the findings.
Scores start at 100 and lose points for failures and warnings:
| Label | Means |
|---|---|
| Good | Every item passes (score 90 or more) |
| Needs work | At least one warning, or a score below 90 |
| Poor | At least one failure, or a score below 70 |
| Error | The page could not be fetched, so there is no score |
SEO checks: Title tag (10–60 characters), Meta description (50–160 characters), H1 heading (exactly one), Canonical URL, Mobile viewport, HTML language, Social preview tags (og:title and og:description), Image alt text, Indexable (no noindex), Section headings (<h2>), Fetch performance (slow if over 2 seconds or over 500 KB of HTML) and Structured data (JSON-LD).
AI-visibility checks: llms.txt, AI crawler access (AI bots named in robots.txt; blocking everything fails), Structured data, Q&A signals (FAQ schema or question headings), Citation metadata (title and description), Stable canonical, Content depth (under 300 characters of text fails, under 1,000 is a warning), Chunkable headings, Answer formatting (lists or tables), Speakable markup, Entity / author markup, Content freshness (published or modified dates) and Language alternates (informational only).
Audits read the HTML that the server returns. They do not run JavaScript, measure Core Web Vitals or report real search rankings, so pages built entirely in the browser may score lower than they deserve. To audit a domain you already track, add the check on that website rather than creating a second site.
Share a PDF report
On any site's Overview (analytics or health-only):
- Choose the date range.
- Choose Preview report to open the PDF in a Report preview window with Download and Close, or choose Download PDF to save it straight away. The file is named
sitepulse-<site>-<from>-to-<to>.pdf.
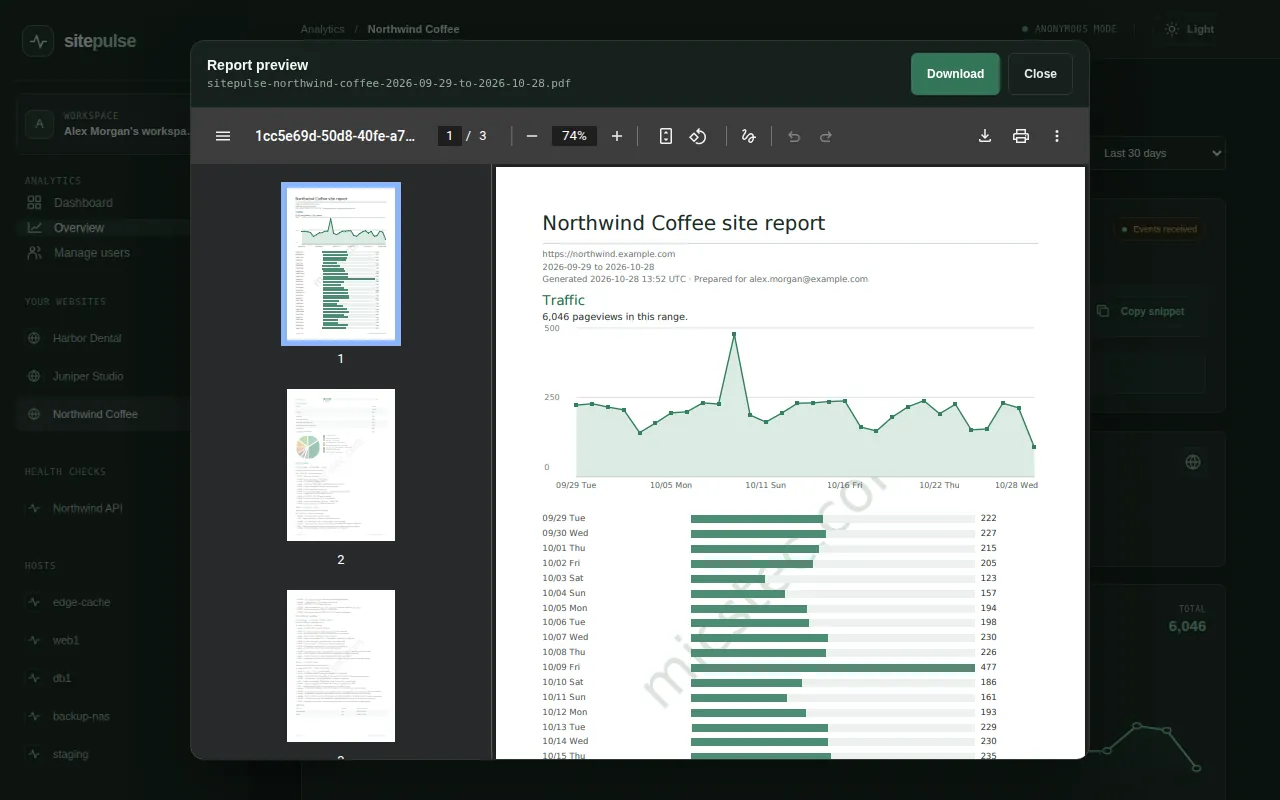
The report contains:
- a header with the site, its origin, the date range, the time it was generated (UTC) and Prepared for your email;
- Traffic: total pageviews, a daily line chart with weekday labels, and one bar per day with its count;
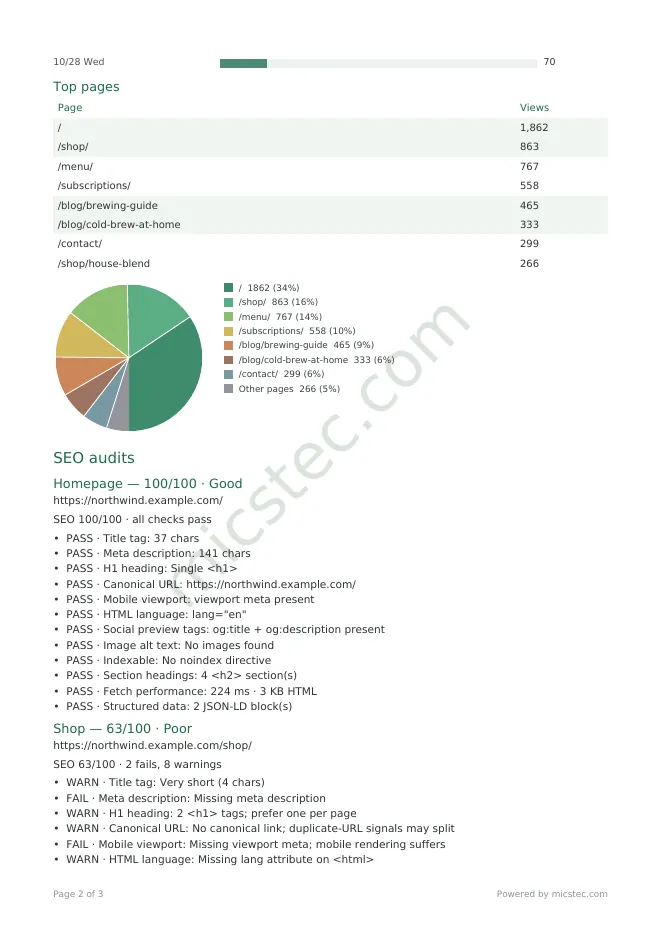
- Top pages: the 8 most-viewed paths as a table and a pie chart;
- SEO audits and AI-visibility audits: every finding from the latest audit of each check, marked PASS, WARN or FAIL;
- Uptime: each check with its current status and the date it was last checked.
The report covers the site's own checks plus any check elsewhere in your workspace whose URL is on the same domain. A health-only site's report notes that it has no traffic data and shows only audits and uptime. Every page carries a diagonal micstec.com watermark and a Powered by micstec.com footer. You can generate up to 6 reports per minute.
Monitor your Linux servers
The Hosts page (SERVERS YOU SSH INTO) shows CPU, memory, disk, load and uptime for your own servers. A small agent on each server pushes a report on a schedule. SitePulse never connects to your servers and never stores SSH credentials.
Add a host
Open Hosts (or choose + beside HOSTS) and choose Add host.
Enter a Host name (for example
web1; up to 80 characters, unique in your workspace) and a Report interval: Every minute to Every hour. The default is Every 5 minutes.Choose Create host + token. A box reads Install the agent on web1 now — the token shows only once. Choose Copy to copy the install command:
curl -fsSL https://tnas_d.micsapp.com/s/sitepulse-host-agent/install-host-agent.sh | sudo bash -s -- --api https://sp.micstec.com --token sp_host_…Run it on the server. It installs
/usr/local/bin/sitepulse-host-agent, writes its settings to the root-only/etc/sitepulse/host-agent.env, adds a cron job and sends a first report.The host switches from Waiting to Live once that report arrives.

Create a separate host entry, with its own token, for each server. If two machines share a token, their figures are mixed together in one row.
| Installer option | Use |
|---|---|
--api URL |
Required: https://sp.micstec.com |
--token TOKEN |
Required on the first install. Leave it out when re-running the installer to reuse the saved token |
--interval SECONDS |
60, 300, 900, 1800 or 3600. The default is 300 on a first install. A re-run without it keeps the current schedule |
--disk PATH |
The mount point to measure (default /) |
--help |
Shows the options |
Read the host cards
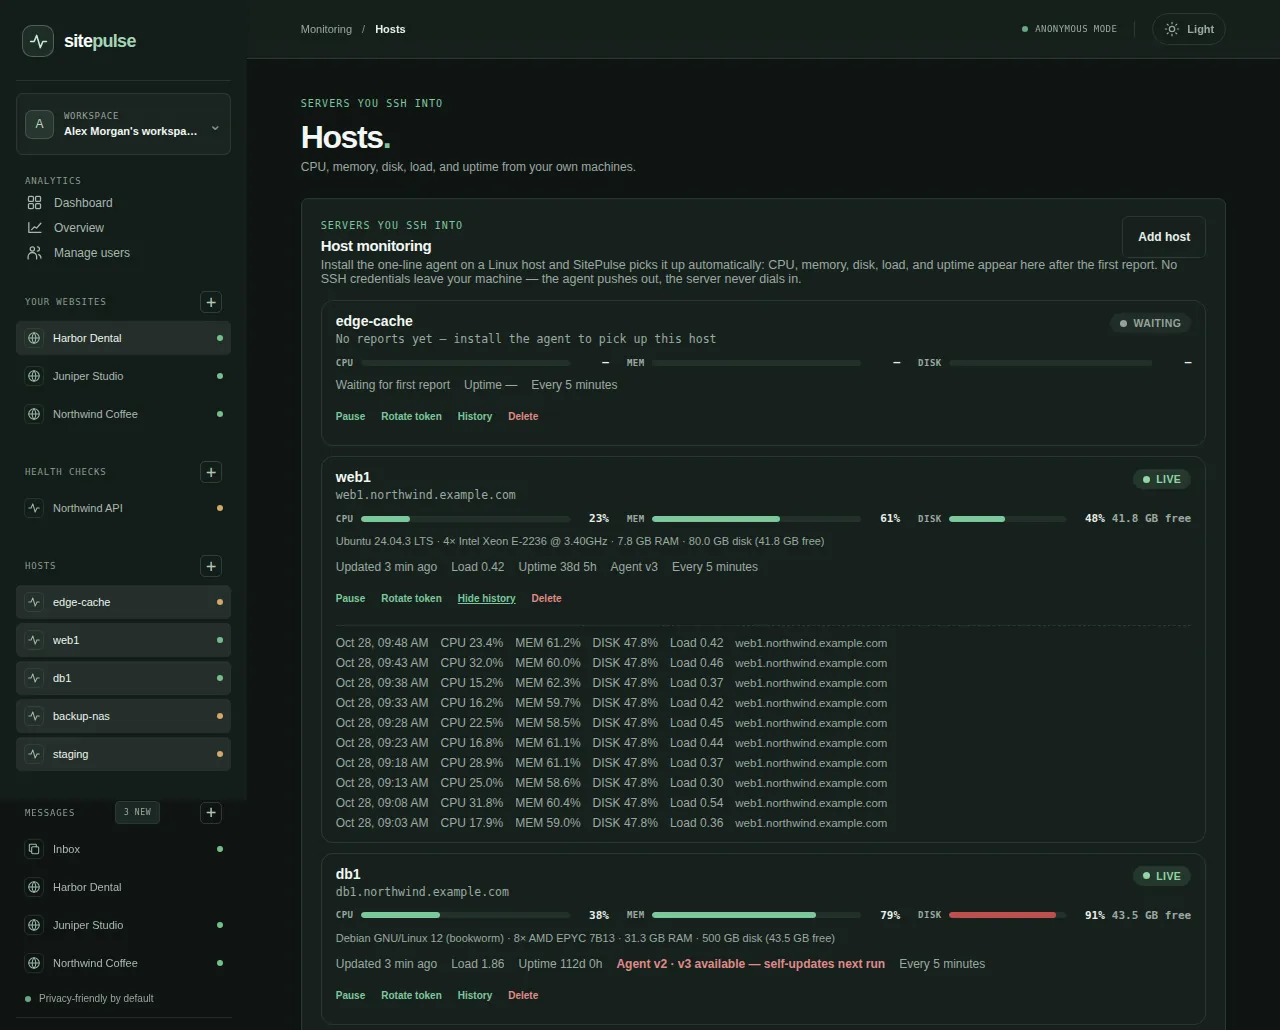
Each host card shows CPU, MEM and DISK bars (red at 90% or above), free disk space in GB, a specification line (operating system, CPU count and model, total RAM and disk), the time of the last report, Load (1-minute average), Uptime, the agent version and the report interval.
| State | Meaning |
|---|---|
| Waiting | No report has arrived yet. Install the agent |
| Live | Reports are arriving on time |
| Stale | No report for more than twice the interval. Check the server, its network and its cron job |
| Paused | You paused the host. Its reports are rejected until you choose Resume |
| Button | What it does |
|---|---|
| Pause / Resume | Stops or restarts accepting reports |
| Rotate token | Confirms, then issues a new token and install command. The old token stops working at once, so re-run the installer with the new line |
| History | Shows the last 10 reports |
| Delete | Asks "Delete this host and its reported history?" and then removes it |
Agents update themselves. When a newer version exists, the card shows "Agent v2 · v3 available — self-updates next run". No sudo password is needed after the first install. Reports are kept for 90 days, up to 1,000 per host.
Collect contact-form messages
SitePulse can file the messages people send through a contact form you already have. You read them in one inbox instead of an email account.
Connect your form
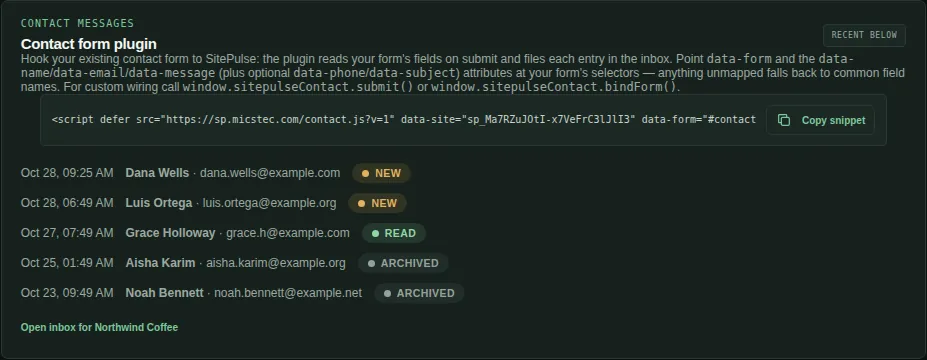
On an analytics site's Overview, find Contact form plugin (CONTACT MESSAGES) and choose Copy snippet:
<script defer src="https://sp.micstec.com/contact.js?v=1" data-site="sp_…" data-form="#contact-form" data-name="#name" data-email="#email" data-phone="#phone" data-subject="#subject" data-message="#message"></script>Add it to the page with your form, and change each selector to match your own form fields (see the table).
Optionally add an element with
id="form-status"(or adata-contact-statusattribute) where the plugin can show progress.Send a test message. It appears in the card's recent list and in Messages.
| Attribute | Points at | If omitted |
|---|---|---|
data-site |
Your site's public ID (required) | — |
data-form |
The <form> to watch |
#contact-form |
data-name |
The name field | [name="name"], #name and similar |
data-email |
The email field | [name="email"], #email, input[type="email"] |
data-phone |
Optional phone field | [name="phone"], input[type="tel"] |
data-subject |
Optional subject field or menu | [name="subject"], #subject, the first <select> |
data-message |
The message box | [name="message"], #message, the first <textarea> |
data-status |
Where to show status text | [data-contact-status], then #form-status |
When a visitor submits the form, the plugin checks for a name, a valid email and a message and sends them to SitePulse. Your visitors see these messages:
| Status text | When |
|---|---|
| "Please complete your name, a valid email, and a message." | A required field is missing or the email looks wrong |
| "Sending…" | While sending (the submit button is disabled) |
| "Thanks — your message was sent." | Saved. The form is cleared |
| "Could not send your message. Please try again." | The request failed |
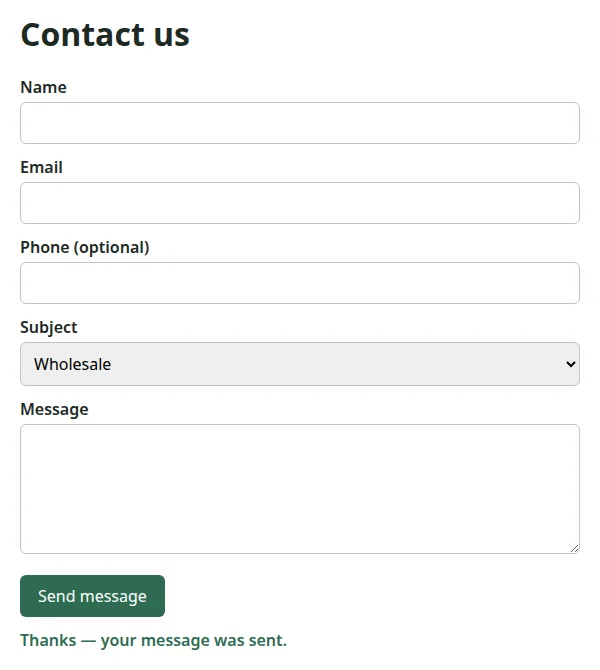
Developers can wire forms by hand with window.sitepulseContact.submit({ name, email, message, phone, subject }) or window.sitepulseContact.bindForm("#my-form", { email: "#work-email" }). The form also fires sitepulse:contact-sent and sitepulse:contact-error events. The micstec.com contact page, for example, sends its form to SitePulse with its own script in this way.
Limits and spam: a name of up to 80 characters, an email of up to 254, a phone number of up to 40, a subject of up to 120 and a message of up to 5,000. Anything longer is cut off. The sending endpoint is public, so SitePulse limits it to 30 messages per minute from one address. A hidden field named website works as a honeypot: if a bot fills it in, SitePulse reports success but saves nothing. Health-only sites do not accept messages.
Work through the inbox
Open Messages (sidebar Inbox, a site's name under MESSAGES, or Open inbox for Site on the plugin card).
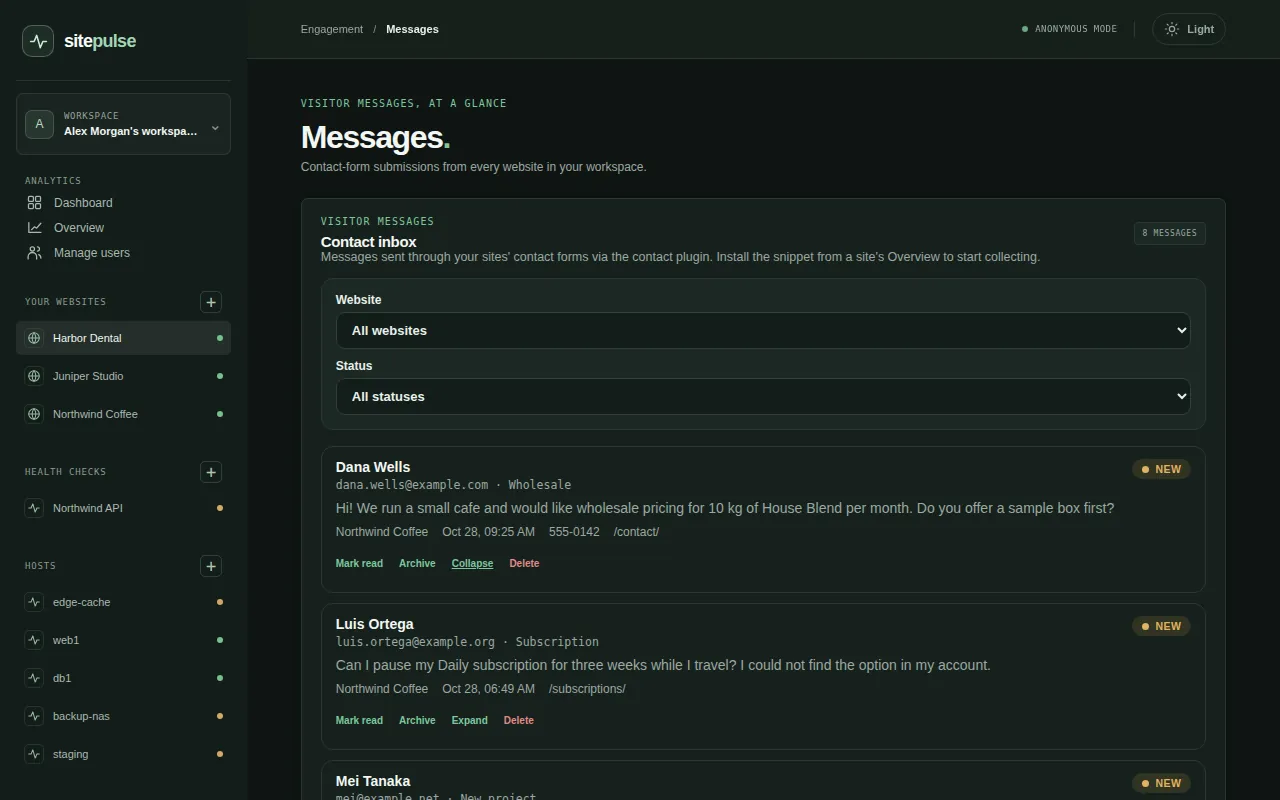
- Filter by Website (All websites or one site) and Status (All statuses, New, Read, Archived). The inbox shows 20 messages per page.
- Each message shows the sender's name and email, the subject, the text (long messages are cut at 160 characters until you choose Expand), the site, the time received, the phone number and the page it was sent from.
- Mark read / Mark unread toggles between New and Read. Archive files the message; Unarchive sets it back to Read. Delete asks for confirmation and cannot be undone.
- Unread counts appear beside MESSAGES in the sidebar and on the Dashboard's Contact inbox card.
SitePulse does not send you an email when a message arrives. Check the inbox, or keep your own email notification alongside it.
Use the command line and API
Create a personal API token
- On the Dashboard, scroll to CLI access (SCRIPTING AND AUTOMATION).
- Enter a Token name (up to 80 characters, for example
laptop) and choose Create token. - Choose Copy token straight away. The
spk_…token is shown only once. - The list shows each token's name, when it was created and when it was last used. Choose Revoke to cancel a token.
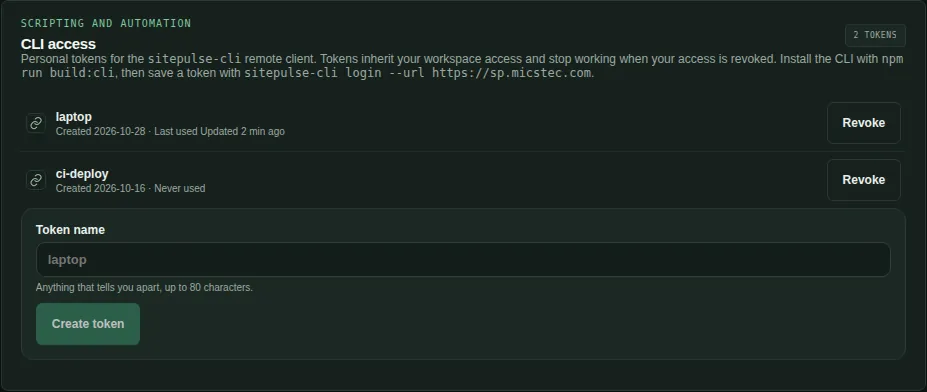
Tokens act as you, inside your workspace. They stop working if your account is suspended, rejected or has its role changed.
Install and sign in to sitepulse-cli
# Linux or macOS, needs Node.js 22+. Add --user to install to ~/.local/bin without sudo.
curl -fsSL https://tnas_d.micsapp.com/s/sitepulse_cli/install-sitepulse-cli.sh | bash

# Sign in with Google in your browser (no token to copy):
sitepulse-cli login --method google-browser --url https://sp.micstec.com
# …or paste a token from the CLI access card:
sitepulse-cli login --url https://sp.micstec.com
The installer checks the download against published checksums. --uninstall removes the CLI. With --method google-browser (or google-link, which prints the link without opening it) a page called Authorize SitePulse CLI opens. Sign in with Google and choose Approve CLI login within 5 minutes. The CLI then saves a new token named cli-<computer name>, or the name given with --token-name.
| Command | Does |
|---|---|
whoami, logout, profiles, use |
Shows the signed-in account, signs out (and revokes the token), and lists or switches saved profiles |
tokens list / create / revoke |
Manages personal tokens |
sites list / show / create / update / verify / install-status |
Manages websites (--kind health creates a health-only site) |
aliases list / add / remove |
Manages secondary origins |
reports summary, reports overview SITE_ID |
Shows pageview totals and top pages (--from / --to, 7 days by default, up to 90 days) |
monitors list / add / show / update / enable / check / delete |
Manages health checks, including method, timeout and slow threshold |
audits schedule / history / run |
Manages SEO and GEO audits |
hosts list / show / create / update / enable / rotate / delete |
Manages host monitoring |
contact summary / inbox / show / status / delete |
Works with the contact inbox |
users list / update |
User administration (administrators only) |
Add --json to any command for machine-readable output. Other global options are --profile, --url, --token, --env-file and --timeout. You can also set SITEPULSE_URL and SITEPULSE_TOKEN. Exit codes are 0 (success), 1 (failure), 2 (usage error), 3 (sign-in or permission problem) and 4 (not found or conflict). delete commands ask for confirmation unless you add --yes. Run sitepulse-cli help <command> for details.
$ sitepulse-cli reports summary
SITE              ORIGIN                              PAGEVIEWS  LAST EVENT
Northwind Coffee  https://northwind.example.com       1196       2026-10-28T13:49:16.563Z
Juniper Studio    https://juniper-studio.example.org  369        2026-10-28T13:48:24.644Z
…
Total: 1696 pageviews (2026-10-22 to 2026-10-28).
(Output from the test copy with example data.)
The CLI uses SitePulse's JSON API under https://sp.micstec.com/api/v1/. Your own scripts can call the same endpoints with an Authorization: Bearer spk_… header. For example, GET /api/v1/sites lists your sites and GET /api/v1/sites/{id}/reports/overview?from=YYYY-MM-DD&to=YYYY-MM-DD returns a site's figures. There is no published API reference beyond the CLI itself. There is no CSV export: use the PDF report, or --json output from the CLI.
Administer users
Administrators see Manage users in the sidebar. The first person ever to sign in became the first administrator.
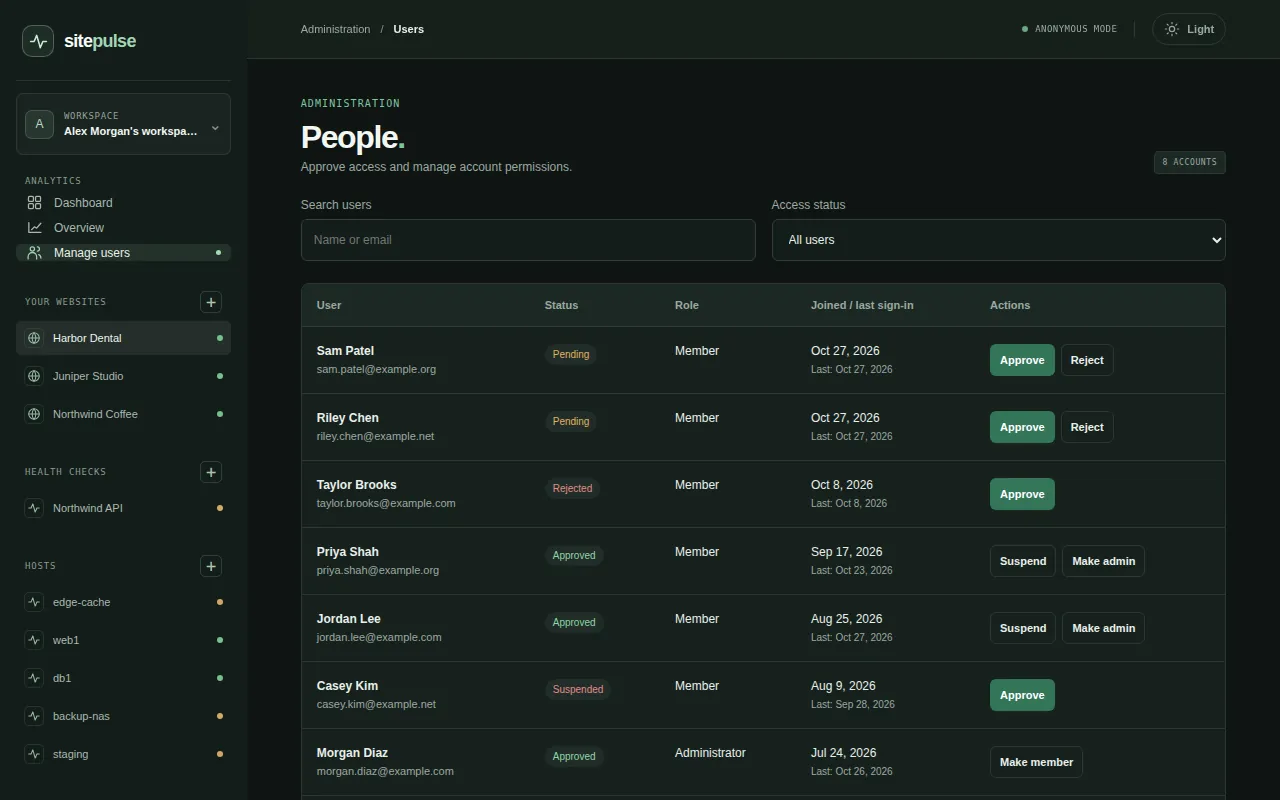
- Use Search users (name or email) and Access status (All users, Pending approval, Approved, Rejected, Suspended) to find people. There are 25 per page.
- Use the buttons in the Actions column:
| Button | Shown for | Effect |
|---|---|---|
| Approve | Pending, rejected or suspended users | Grants access; a workspace is ready for them |
| Reject | Pending users | Refuses access (confirmation required) |
| Suspend | Approved members | Removes access and signs them out everywhere (confirmation required) |
| Make admin | Approved members | Grants administrator rights (confirmation required) |
| Make member | Administrators | Removes administrator rights (confirmation required) |
You cannot change your own account (it shows Current account), and SitePulse always keeps at least one approved administrator. Changing someone's status or role signs them out and cancels their API tokens. Administrator rights do not give access to other people's workspaces, and there is no way to share or invite people into a workspace.
Install the app and use it on a phone
- Install: in Chrome or Edge use Install app in the address bar or menu. On iPhone or iPad use Safari's Share → Add to Home Screen. SitePulse opens in its own window.
- Offline: without a connection the app shows SitePulse is offline with a Try again button. Your data is never stored on the device, so everything needs a connection.
- Phones: the layout adapts to small screens. The sidebar shrinks to a strip of icons, and cards stack in one column.
What SitePulse does not do
| Not available | What to use instead |
|---|---|
| Referrers, traffic sources and campaign (UTM) reports | Referrer host names are stored but not shown. Query strings, including UTM tags, are dropped |
| Devices, browsers, operating systems, screen sizes, countries or cities | Not collected |
| Unique visitors, sessions, bounce rate, time on page | Not available. Every figure is a pageview count |
| A live "visitors right now" view | Figures refresh every 15 seconds and show the time of the latest pageview |
| Custom events, goals or conversions | Not available. Only pageviews are counted |
| Downtime or message alerts (email, SMS, webhooks) | Check the dashboard. Poll the CLI or API from your own scripts if you need alerts |
| CSV or spreadsheet export | The PDF report, or --json CLI output |
| Shared or team workspaces | Each approved person has their own workspace |
| Deleting a website | Not available. Switch it to health-only or remove its snippet |
Privacy, security and data
- Your visitors: the tracker sets no cookies, uses no local storage and creates no visitor ID. SitePulse stores the path, the time, the referring host name and the browser language for each pageview, and nothing that identifies a person. Only registered domains are accepted.
- Contact messages do contain personal details: the name, email, optional phone number and subject, message and page. Install the plugin only on forms where people expect a reply, and delete messages you no longer need.
- Checks and audits keep the status code, timing, score and findings, never the page content. They cannot reach private or internal network addresses, and every redirect is checked again against the same rule.
- Tokens: SitePulse stores only a fingerprint (hash) of API and host tokens. That is why each token is shown only once.
- Retention: check results and host reports are kept for 90 days (up to 1,000 per check or host). Pageviews and messages stay until the site or message is removed.
- Workspaces: every request is limited to your own workspace, including for administrators.
Troubleshooting
| Problem | What to check |
|---|---|
| Status stays Awaiting first visit | View your published page's source: is the snippet in <head> with your data-site ID? Does the page's address match the registered origin exactly, including https:// and www? If not, add a secondary origin. Is data-mode="off" set? |
| Browser console shows a Content Security Policy error | Allow https://sp.micstec.com in script-src and connect-src |
| Numbers seem low | Ad blockers can stop analytics scripts, and pages inside iframes are not counted. Treat figures as a lower bound |
| Single-page app counts each view twice, or not at all | Use either automatic tracking or data-manual="true" with window.sitepulse.page(), not both |
| "That address is not allowed for health checks" | The URL resolves to a private or internal address. Use the public address |
| A check shows Error but the page opens for you | DNS, TLS certificate, timeout (over 10 seconds) or more than 5 redirects. Check the error in History. The page may also block automated requests |
| "Too many manual checks" / "Too many audit runs" / "Too many report downloads" | Rate limits: 12 checks, 12 audits or 6 reports per minute. Wait a minute |
| An audit scores low on a JavaScript-built page | Audits read the raw HTML. Render titles, headings and text on the server where you can |
| A host stays Waiting | Run the install command with sudo and make sure the server can reach https://sp.micstec.com |
| A host shows Stale | Check that the server is running, its clock is correct, it can reach SitePulse and its cron job still exists |
| Lost a host token | Choose Rotate token and run the new command. A re-install without --token reuses the token saved on the server |
| Contact form shows "Could not send your message" | Check the data-site ID, that the site is an analytics site (not health-only), and that a CSP allows connect-src https://sp.micstec.com |
| Approval screen will not go away | Ask an administrator to approve your Google account, then choose Check approval |
| "Google sign-in could not load" | A blocker or a network filter is stopping accounts.google.com. Allow it, then choose Retry Google sign-in |
FAQ
Does SitePulse use cookies or need a cookie banner? The tracker sets no cookies and no visitor IDs, which is why SitePulse calls it anonymous. Whether you need a notice depends on your local law. If you use a consent banner, load the snippet with data-mode="off" and switch it on after consent.
Can I see where visitors came from? No. The referring host name is recorded, but no screen, report or CLI command shows it at present.
How many sites, checks or hosts can I add? The app sets no limits on the number of sites, checks or hosts. Ask your administrator if your use is large.
Will I be told when my site goes down? No. SitePulse shows status in the dashboard but sends no notifications.
Can a colleague see my workspace? No. Workspaces are private to each account. Share a PDF report instead.
Why does the Popular pages card never go above 8? The list shows the top 8 paths, and the card counts the entries in that list.
Is there a mobile app in an app store? No. Install the web app from your browser instead (see Install the app). No promotional videos or store listings exist for SitePulse.